
Risk diagnosis for AI-built services
Just enter a URL, and
hidden risks become visible.
Across 10 categories and 100 checkpoints covering technology, operations, data, and legal, we surface the weaknesses hiding inside a service that merely "works."
- Just a URL — about 1 minute
- No credit card required
We're live on Product Hunt. An upvote would mean a lot to us!

24 seconds
What Code Rakuda does.
From entering a URL to seeing your fix priorities — the whole flow in 24 seconds.
Real output
See your weaknesses at a glance, with scores and a radar chart.
Overall score, category radar, risk distribution, and key findings — this is an actual diagnostic report screen.
- Overall score (out of 1,000) with an A–E rating
- Category radar and risk distribution visualize weaknesses
- Top-priority risks shown first
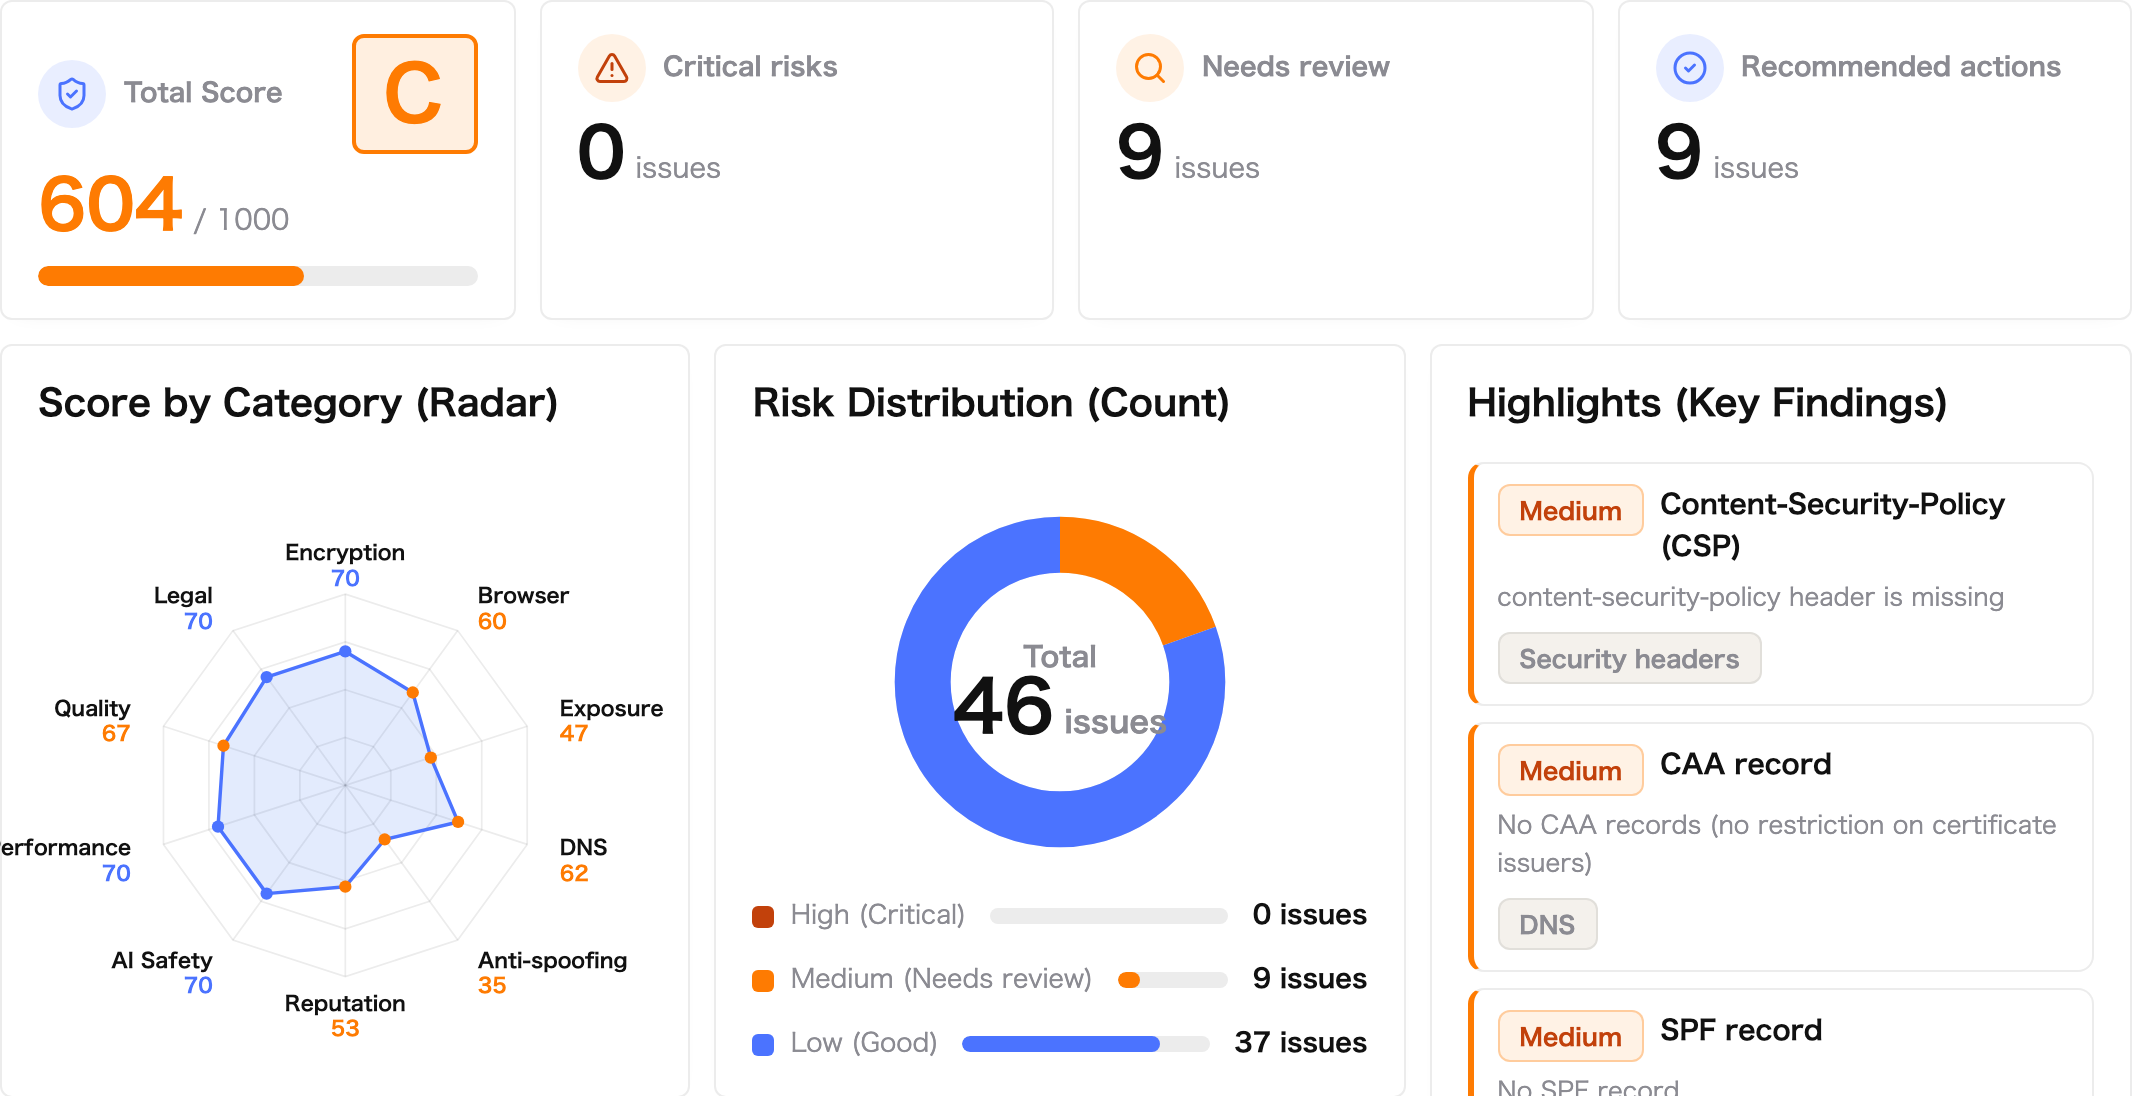
An actual diagnostic report screen (sample)
10
Diagnostic categories
100
Checkpoints
1000pts
Max score
~1min
Free diagnosis time
01 Why diagnose now
Information is leaking from apps that just "work."
API key leaks, exposed personal data, and lost production data from AI-built services are being reported worldwide. Most aren't sophisticated attacks — gaps in permission settings are the cause.
Other people's data is wide open
With RLS or Firestore Rules left unset, simply changing the URL exposes someone else's information.
API keys exposed on the frontend
service_role keys and payment or AI secrets end up in public JS and get abused.
Runaway AI API costs
With no request or token limits, spam or automated calls trigger massive bills.
Missing terms and legal notices
Charging users without terms of service, legal disclosures, or consent flows invites disputes and takedowns.
02 Scope
Diagnosed across 10 categories and 100 checkpoints
We surface risks across technology, operations, data, and legal — not just code.
Technology stack
Frontend, API, authentication, database, integrations, infrastructure, architecture
Development process
Git, code review, CI/CD, releases, issue tracking
Security
Authentication, authorization, API protection, input validation, encryption, auditing, incident response
Scalability
Load balancing, autoscaling, response times, caching, queues, rate limiting
Availability & resilience
Redundancy, backups, recovery, failure detection, SLA/SLO
Testing
Unit, integration, E2E, regression, API, UI, load, security, and CI testing
Operations & monitoring
Logs, errors, metrics, alerts, dashboards, cost monitoring
Maintainability
Readability, reusability, structure, naming, design principles, documentation
Data management
Database design, relations, indexes, transactions, personal data handling
Legal & policies
Terms of service, privacy, legal disclosures, consent flows, refunds/cancellation, AI usage, disclaimers
03 How it works
From entering a URL to an improvement plan
We don't ask for GitHub access up front. Start with just a URL and a self-assessment.
Enter your service URL
No GitHub connection needed. Start with the URL of your live service.
Answer a self-assessment
Just select what applies: login, payments, AI APIs, personal data, legal documents, usage.
Run the free diagnosis
From the URL and self-assessment, we quickly flag whether risks are worth a closer look.
10-category quick results
See areas that need attention and likely risks, and whether it's worth moving to the next step.
Diagnostic Report
A full diagnosis via read-only GitHub access or a full code upload.
Improvement Support
What to fix, and in what order — we design your improvement roadmap.
04 What you get
Not just a score — the order to fix things in.
Your overall score and the balance across 10 axes, critical risks, and the one thing to fix first. With estimated difficulty and effort included, your next move becomes clear.
- Overall score (out of 1,000) with an A–E rating
- Critical / moderate / minor risks with improvement priority
- Sorted by what AI can fix, what needs an engineer, and what needs legal review
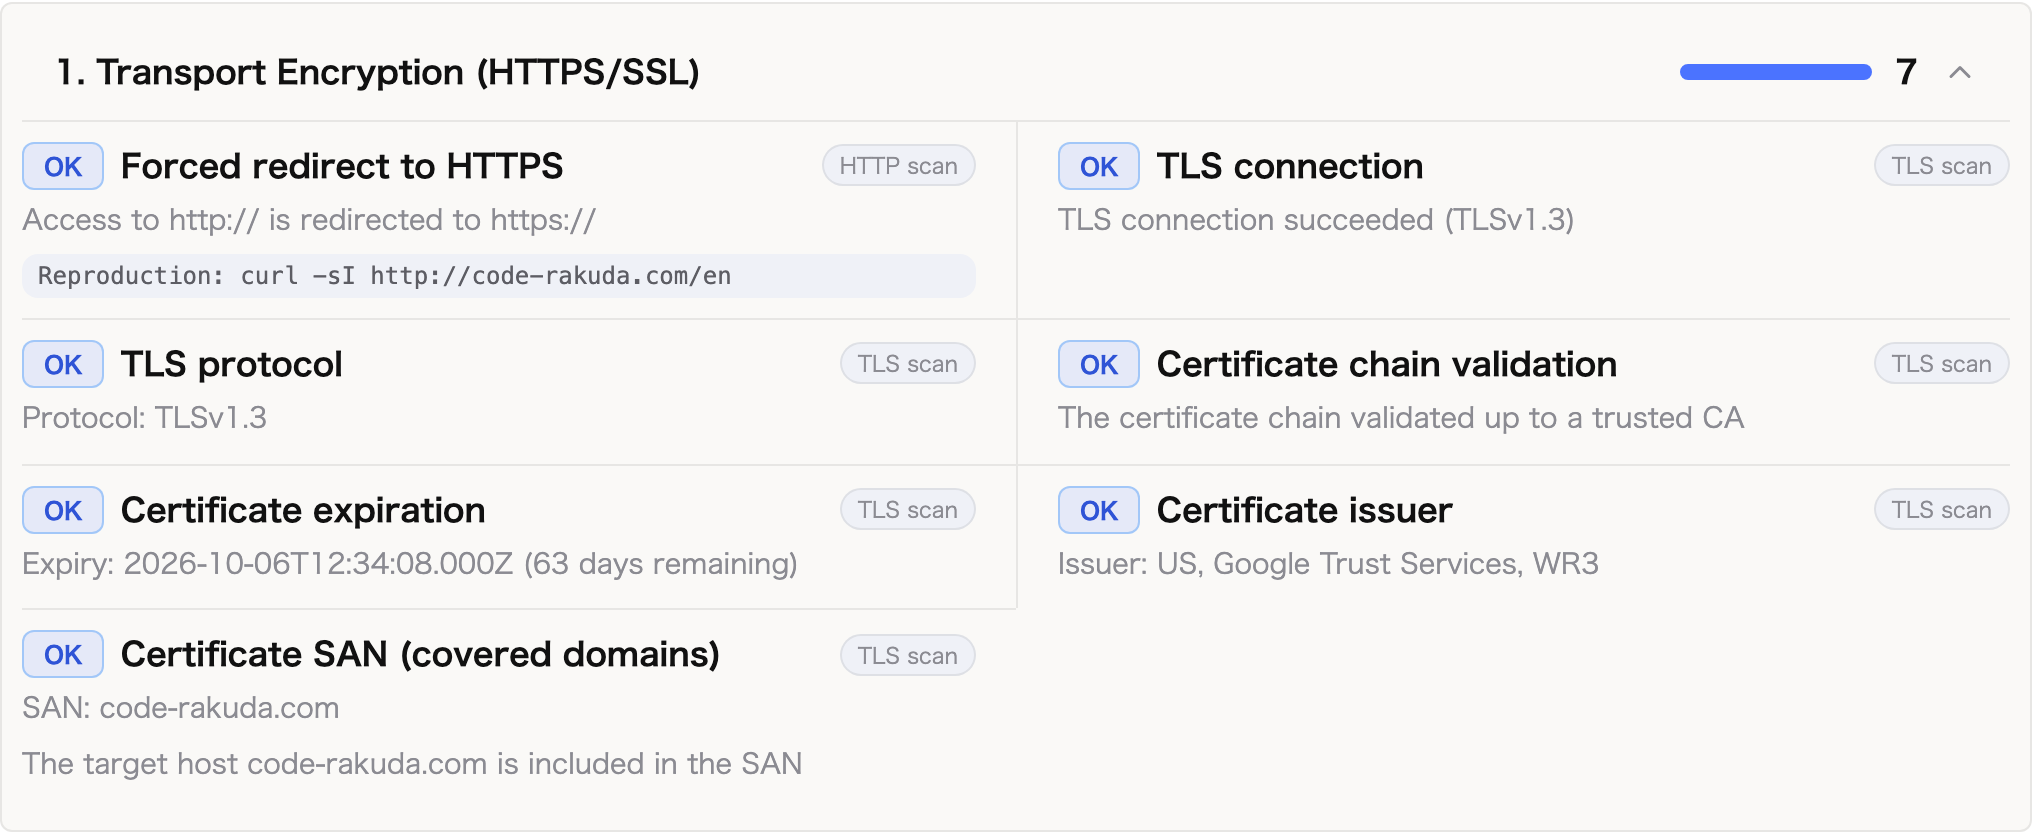
A detailed check example from the report (sample)
05 Pricing
Plans
From a free quick check to a full report and improvement support.
Get a first read on your risk
Using just your public URL and a self-assessment, quickly surface the areas worth a closer look.
- Start without connecting GitHub
- External checks: HTTPS, headers, legal links, and more
- Self-assessment covering login, payments, AI APIs, personal data, and legal documents
- A quick matrix across 10 categories
- Input for deciding whether to move on to the Diagnostic Report
Quick score, categories to watch, and risk areas to check next
Our core plan for pinpointing problems
We read your code and configuration and organize the risks to fix before and after release, by priority.
- Read-only GitHub access or a full code upload
- Detailed diagnosis across 10 categories and 100 checkpoints
- Review of authentication, authorization, database rules, and API protection
- Operational risk review for AI, payments, personal data, and integrations
- Critical / moderate / minor risks organized with supporting evidence
- Estimated fix difficulty and effort
Detailed score, list of findings, severity, improvement priority, fix difficulty
We design the order to fix things in
Based on the diagnostic results and how your service actually runs, we set an improvement plan that goes as far as design, implementation, and operations.
- Diagnostic Report plus interviews and server log review
- Business impact and release priority organized
- A custom plan proposed for fixes through implementation
- Spec drafting and infrastructure estimates from planning documents and specs
- Assessment of feasibility and whether we can take on the work
- Sandbox setup for running AI agents
- Sorted by what AI can fix, what to outsource, and what needs legal review
Improvement roadmap, fix specifications, implementation plan, spec drafting and infrastructure estimates
Prefer to review materials first? Download the service brochure
06 For your peace of mind
We never touch your code without permission.
We never write to your code
GitHub access is read-only. We diagnose by reading only — no edits or pull requests.
We don't store your code, as a rule
Uploaded code is deleted after diagnosis. Any secrets we detect are masked.
Only you can view the results
Your diagnostic results are yours alone — never shared with third parties.
The legal & policies category detects gaps in documents, disclosures, and consent flows — it is not a legal judgment by an attorney.
07 FAQ
FAQ
What does the free diagnosis tell me?
From your public URL and self-assessment answers, we show a quick matrix across 10 categories, categories to watch, and risk areas worth a closer look — in about a minute. No GitHub connection needed.
Do you need write access to my code to diagnose it?
No. GitHub access is read-only — we diagnose by reading only, with no edits or pull requests. You can also diagnose by uploading your full codebase.
Is uploaded code stored?
As a rule, no. Uploaded code is deleted after diagnosis, and any secrets we detect are masked.
How much does it cost?
Free Diagnosis is ¥0, the Diagnostic Report is ¥29,800 (tax included), and Improvement Support starts at ¥198,000 (tax included).
Are diagnostic results shared with third parties?
No. Only you can view your diagnostic results.
Is the legal & policies diagnosis legal advice?
No. It detects gaps in documents, disclosures, and consent flows — such as terms of service or legal notices — and is not a legal judgment by an attorney.
Start with a free look at your risk.
Just enter your service URL. In about a minute, you'll have a read on your risk.
Prefer to review materials first? Download the service brochure